


Ultimately, the only real purpose of price is to limit demand. If something is plentiful, then it is cheap because there is lots of that product to be consumed, and if something is scarce, then the price has to be high enough that not everyone wants to use it. Nowhere is this truer than in the agricultural commodity markets as the price of grain goes up and down in order to ration out the demand so that grain moves to market in an organized fashion. The relationship between supply, demand and price is remarkably rational and not difficult to anticipate. Developing a good understanding of how this relationship works is a critical skill for participants in the market. Fortunately, there is a depth of historical market information which makes understanding this relationship and anticipating price moves reasonably predictable.
Rather than try to work with the entire breadth of the supply and demand situation in any commodity market, the simplest route is to focus on the “stocks to use ratio.” This measure really distills it down to a ratio of how much is left over after we covered all of the demand. In years with either large crops or limited demand, the stocks to use ratios are big, indicating that there was a lot of wheat left over. In years when there is either smaller crops or significant demand, the stocks to use ratio is very low as we move more of the available inventory out to end users.
In 2007–2008 Australia had a severe drought which devastated their wheat production. With less Australian wheat available to the world market, even though the North American wheat crop was reasonably large, demand was so great that nearly all of it was consumed and the resulting stocks to use was very tight. Since price has to ration demand, in the tight stocks situations like 2008, the price rallied significantly in order to destroy unquenchable demand.
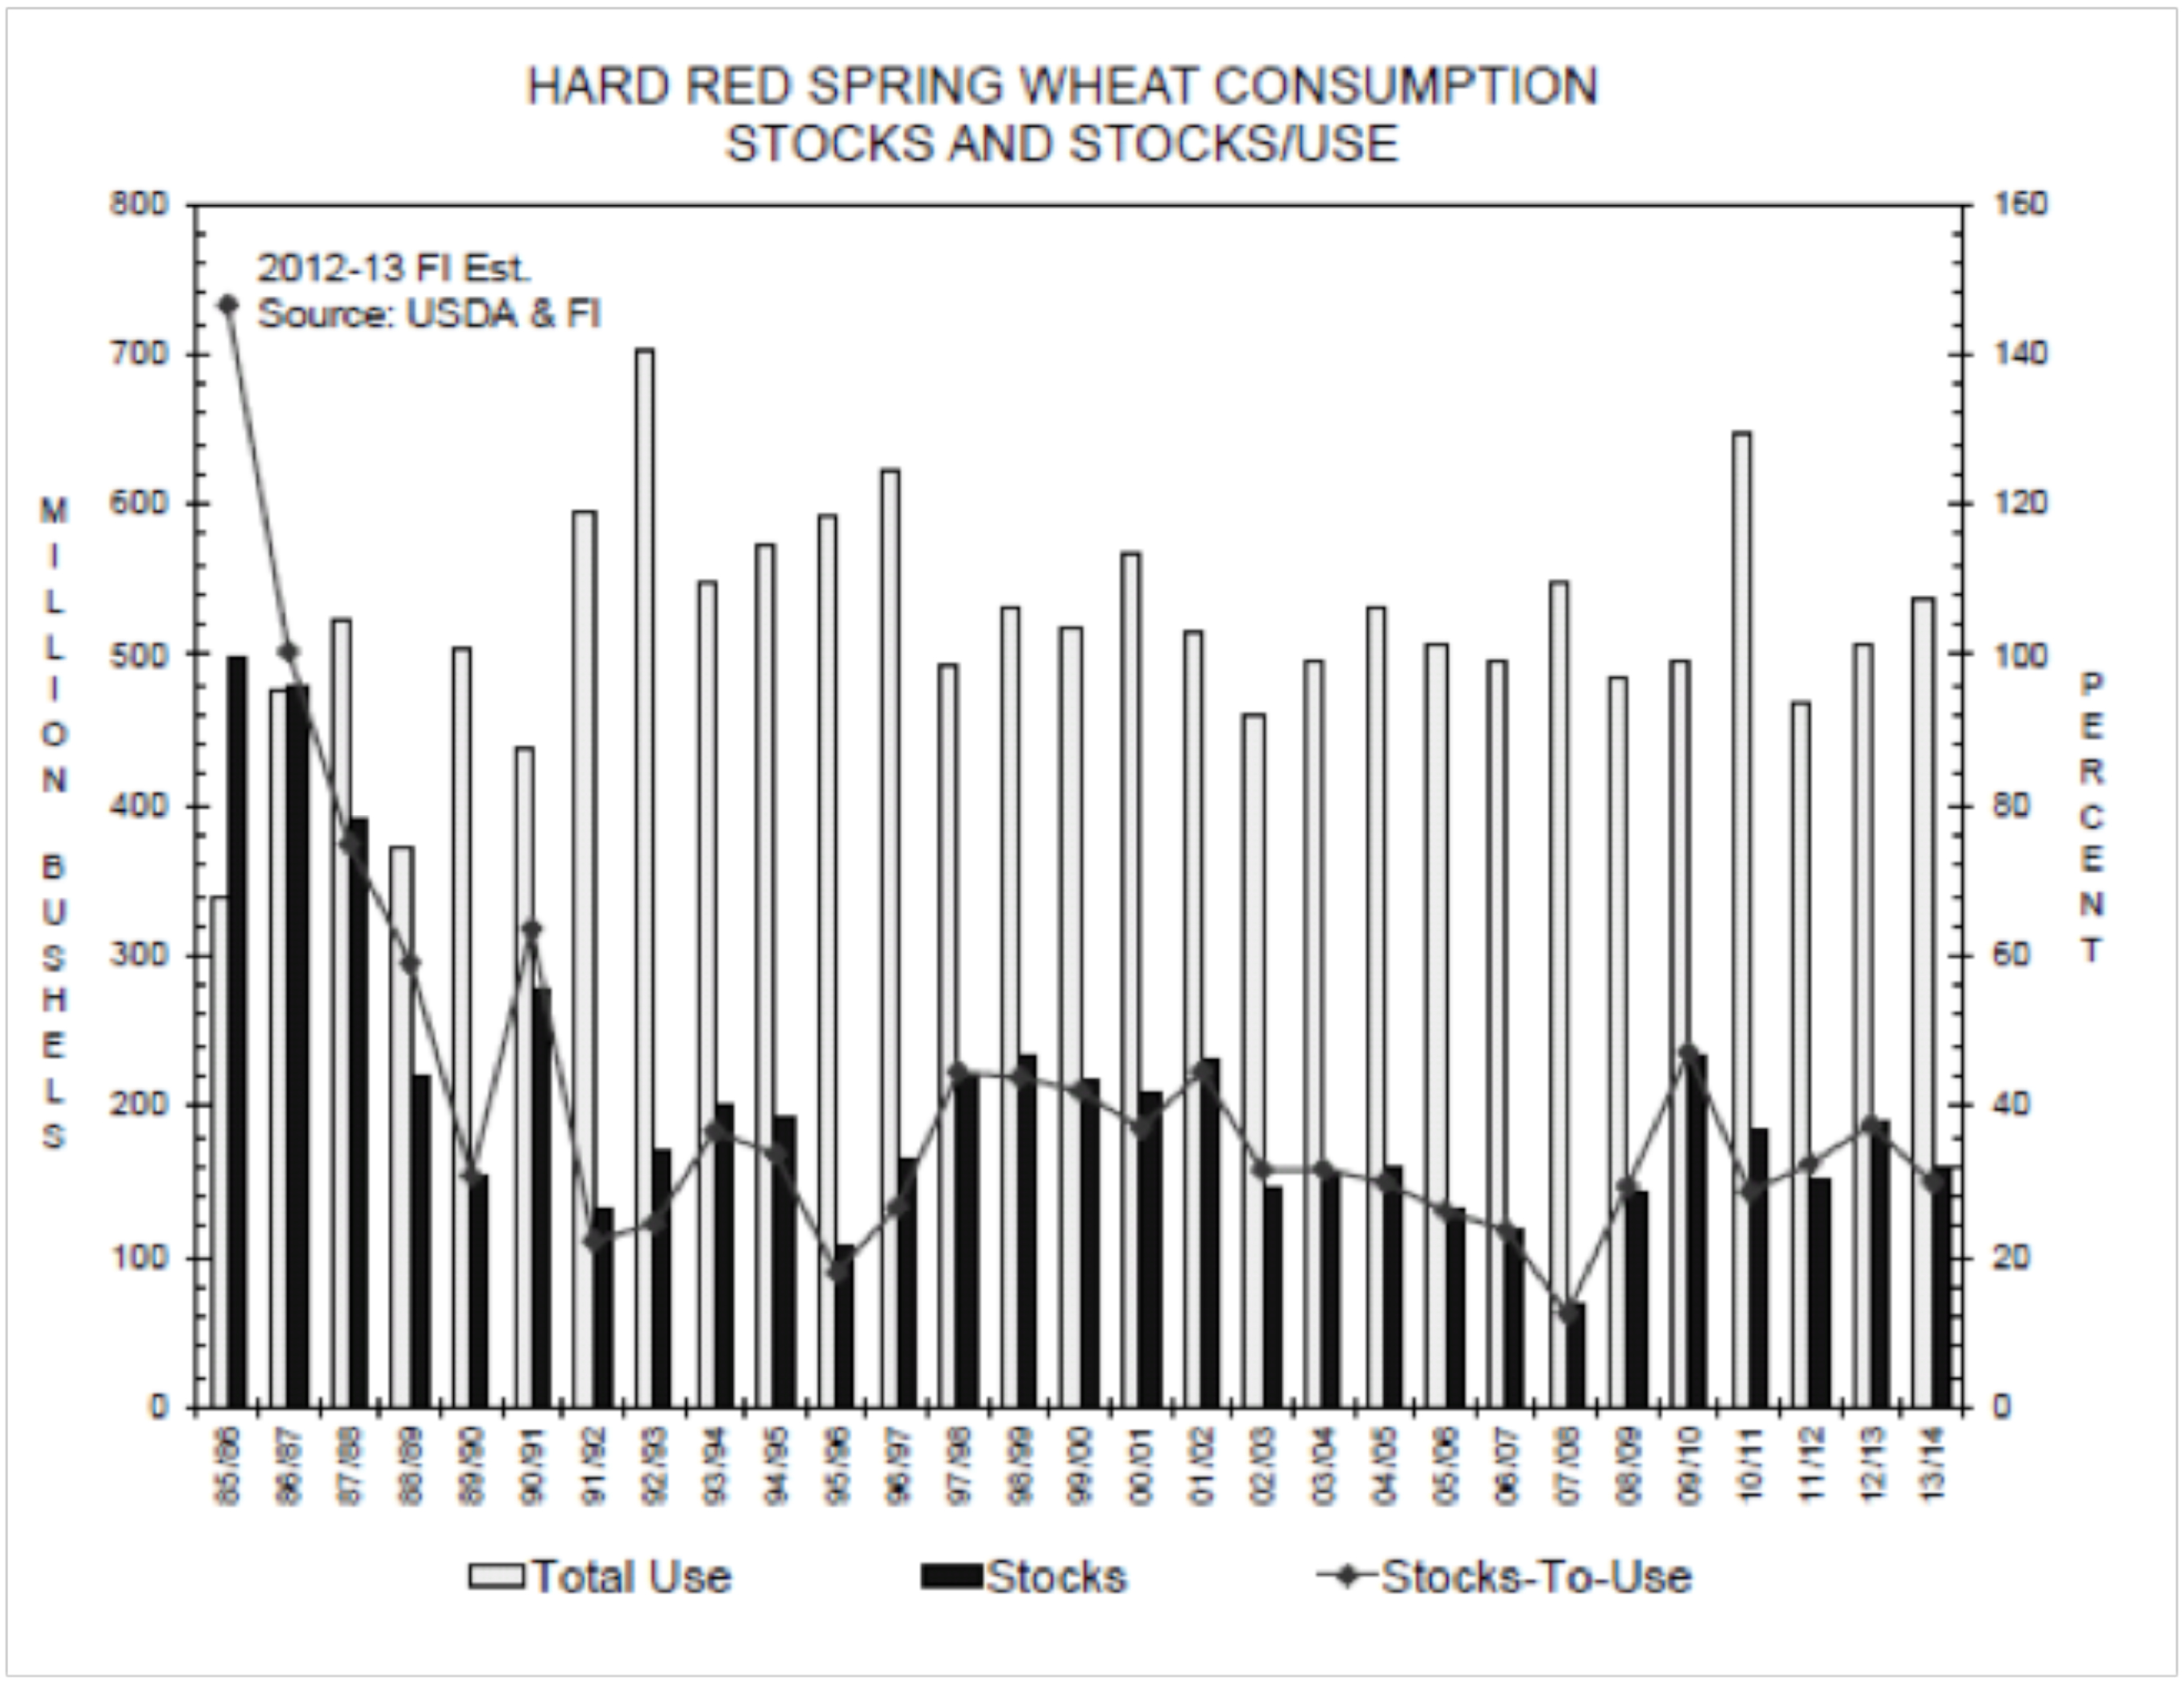
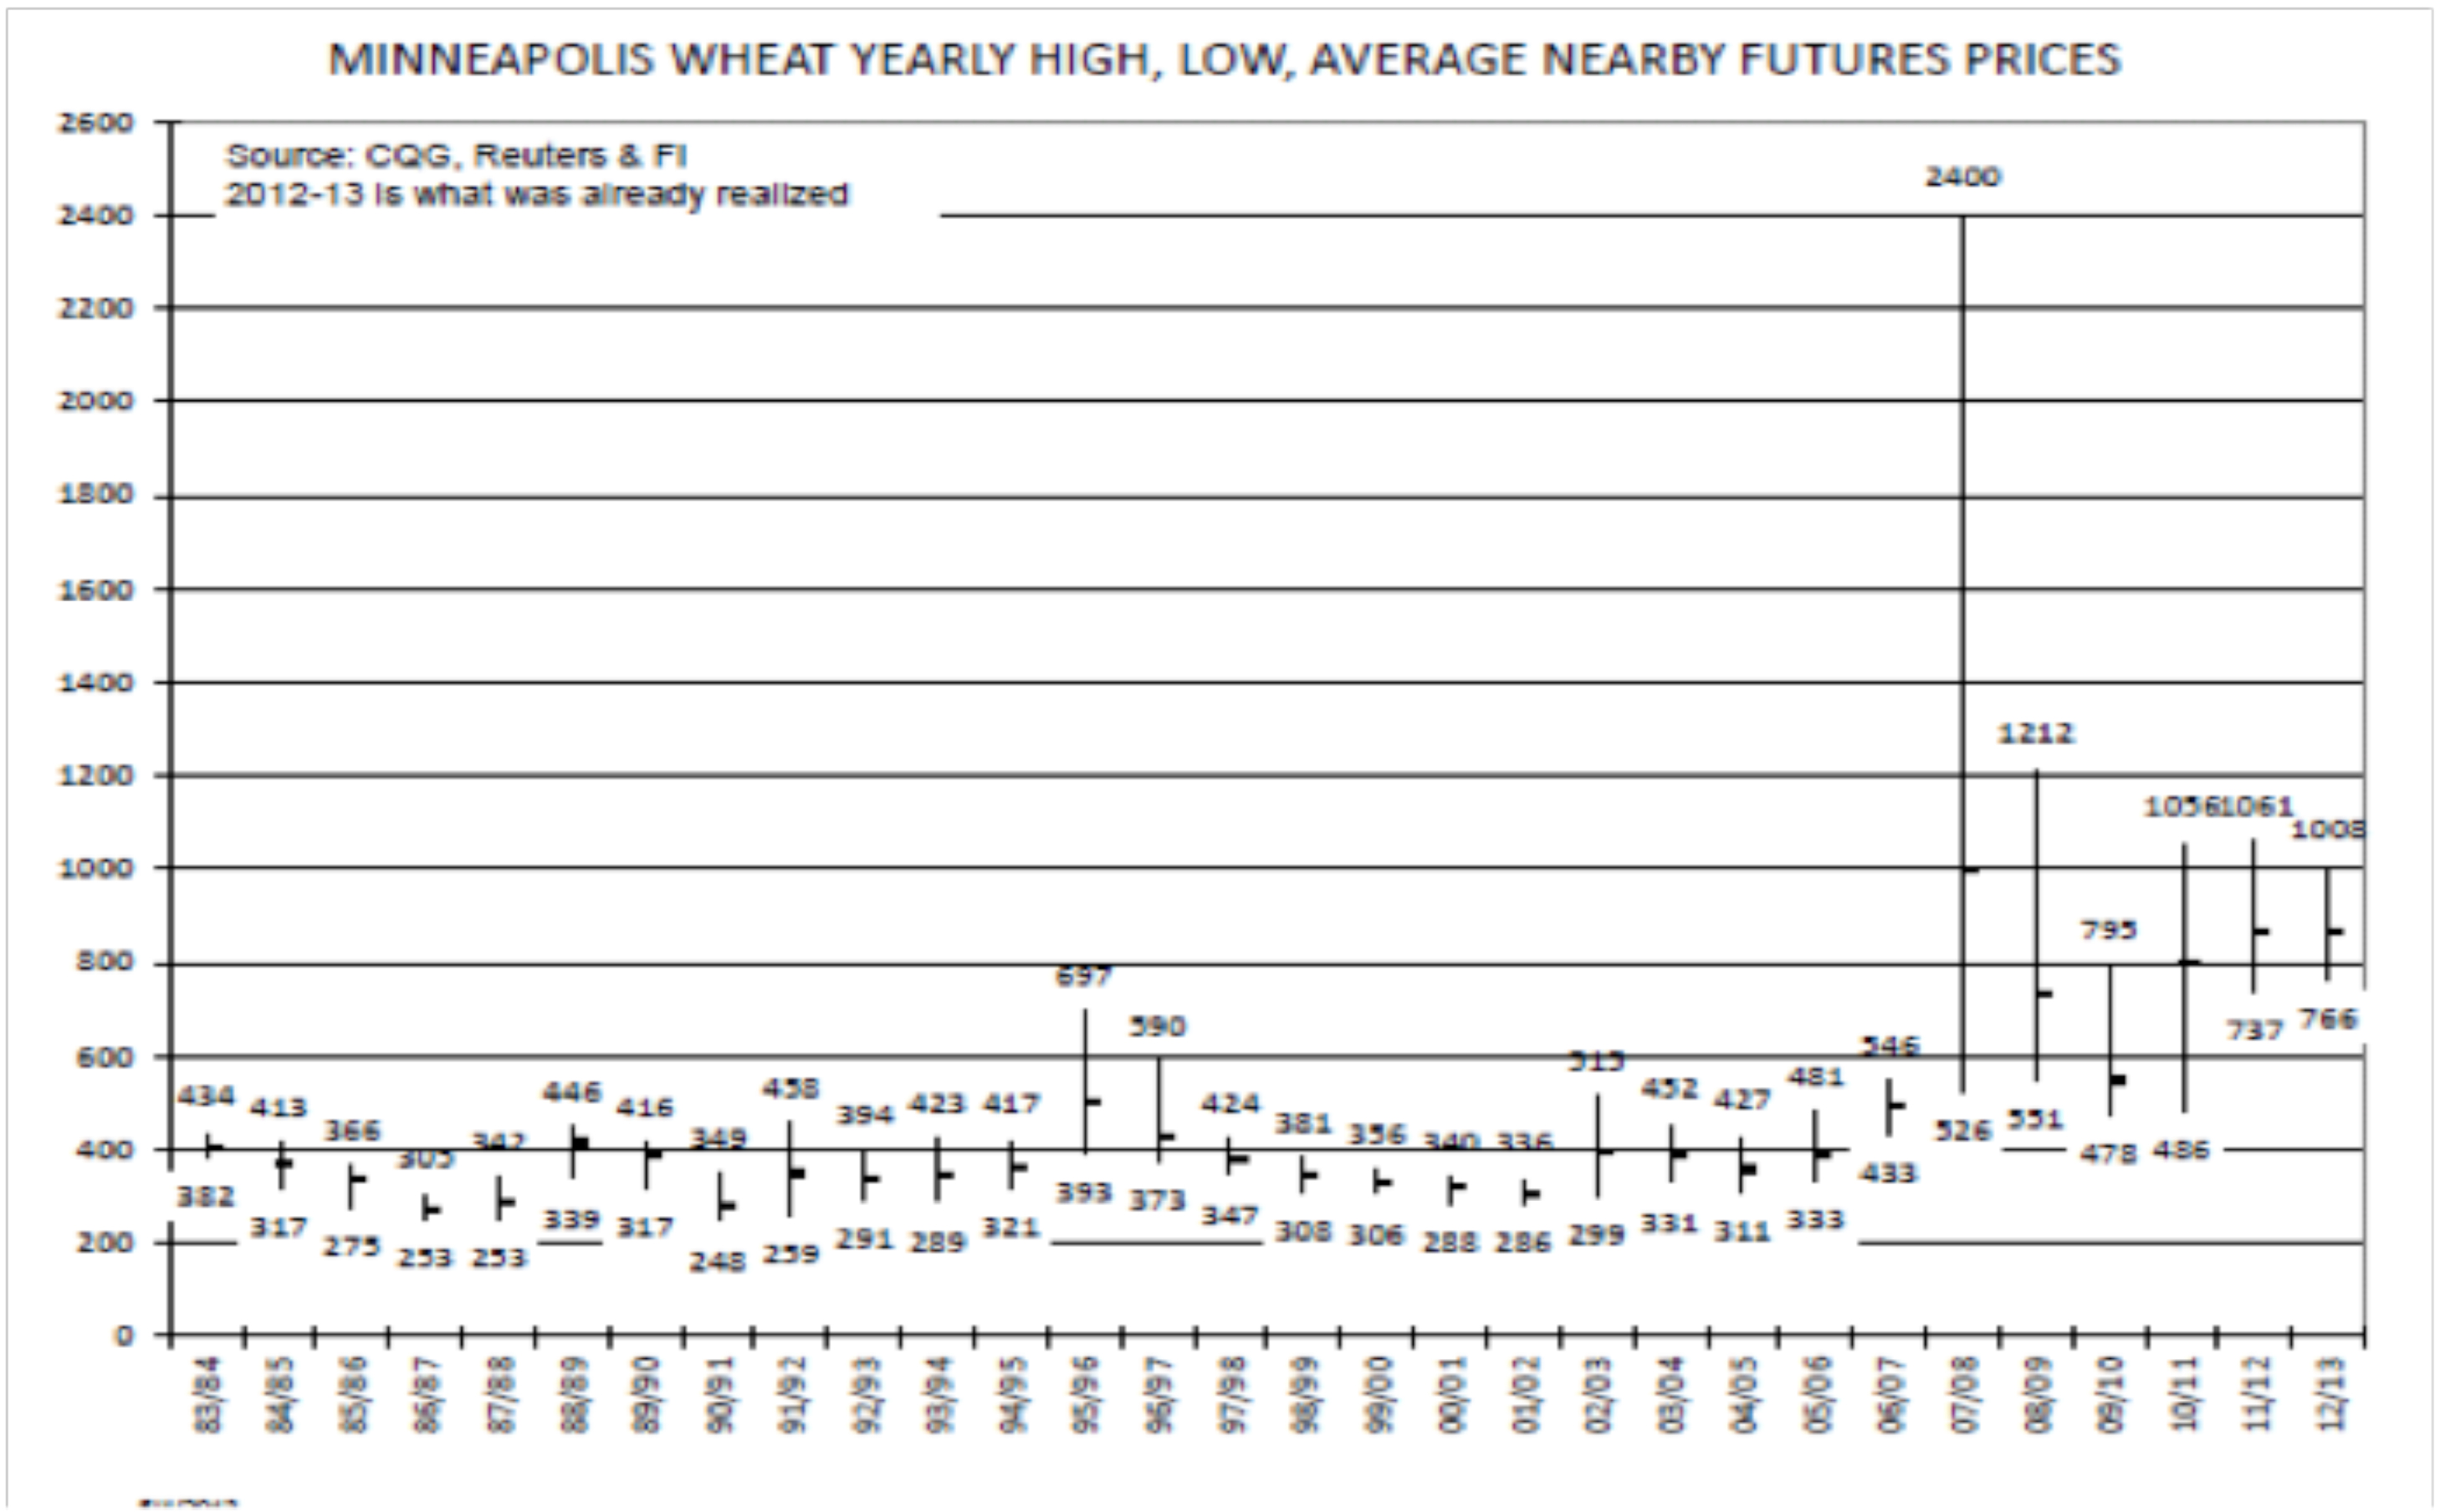
If you compare the dark bars on the chart above, (the spring wheat stocks to use ratios), to the length of the bars on the chart below, (which is the total price range of the Minneapolis wheat futures for the year), it’s immediately obvious that the price is most active in situations where the stocks are tightest.
When you compile the data from both the stocks to use and price charts, you’ll arrive at a matrix like the graph below. Essentially, this gives you the capacity to anticipate where the Minneapolis wheat futures will balance based on the currently held estimates of the red spring wheat crop’s supply and demand situation. For example, today the estimated stocks to use ratio for the 2013 red spring wheat crop is 29%, so the anticipated average Minneapolis wheat futures price will be $7.75.
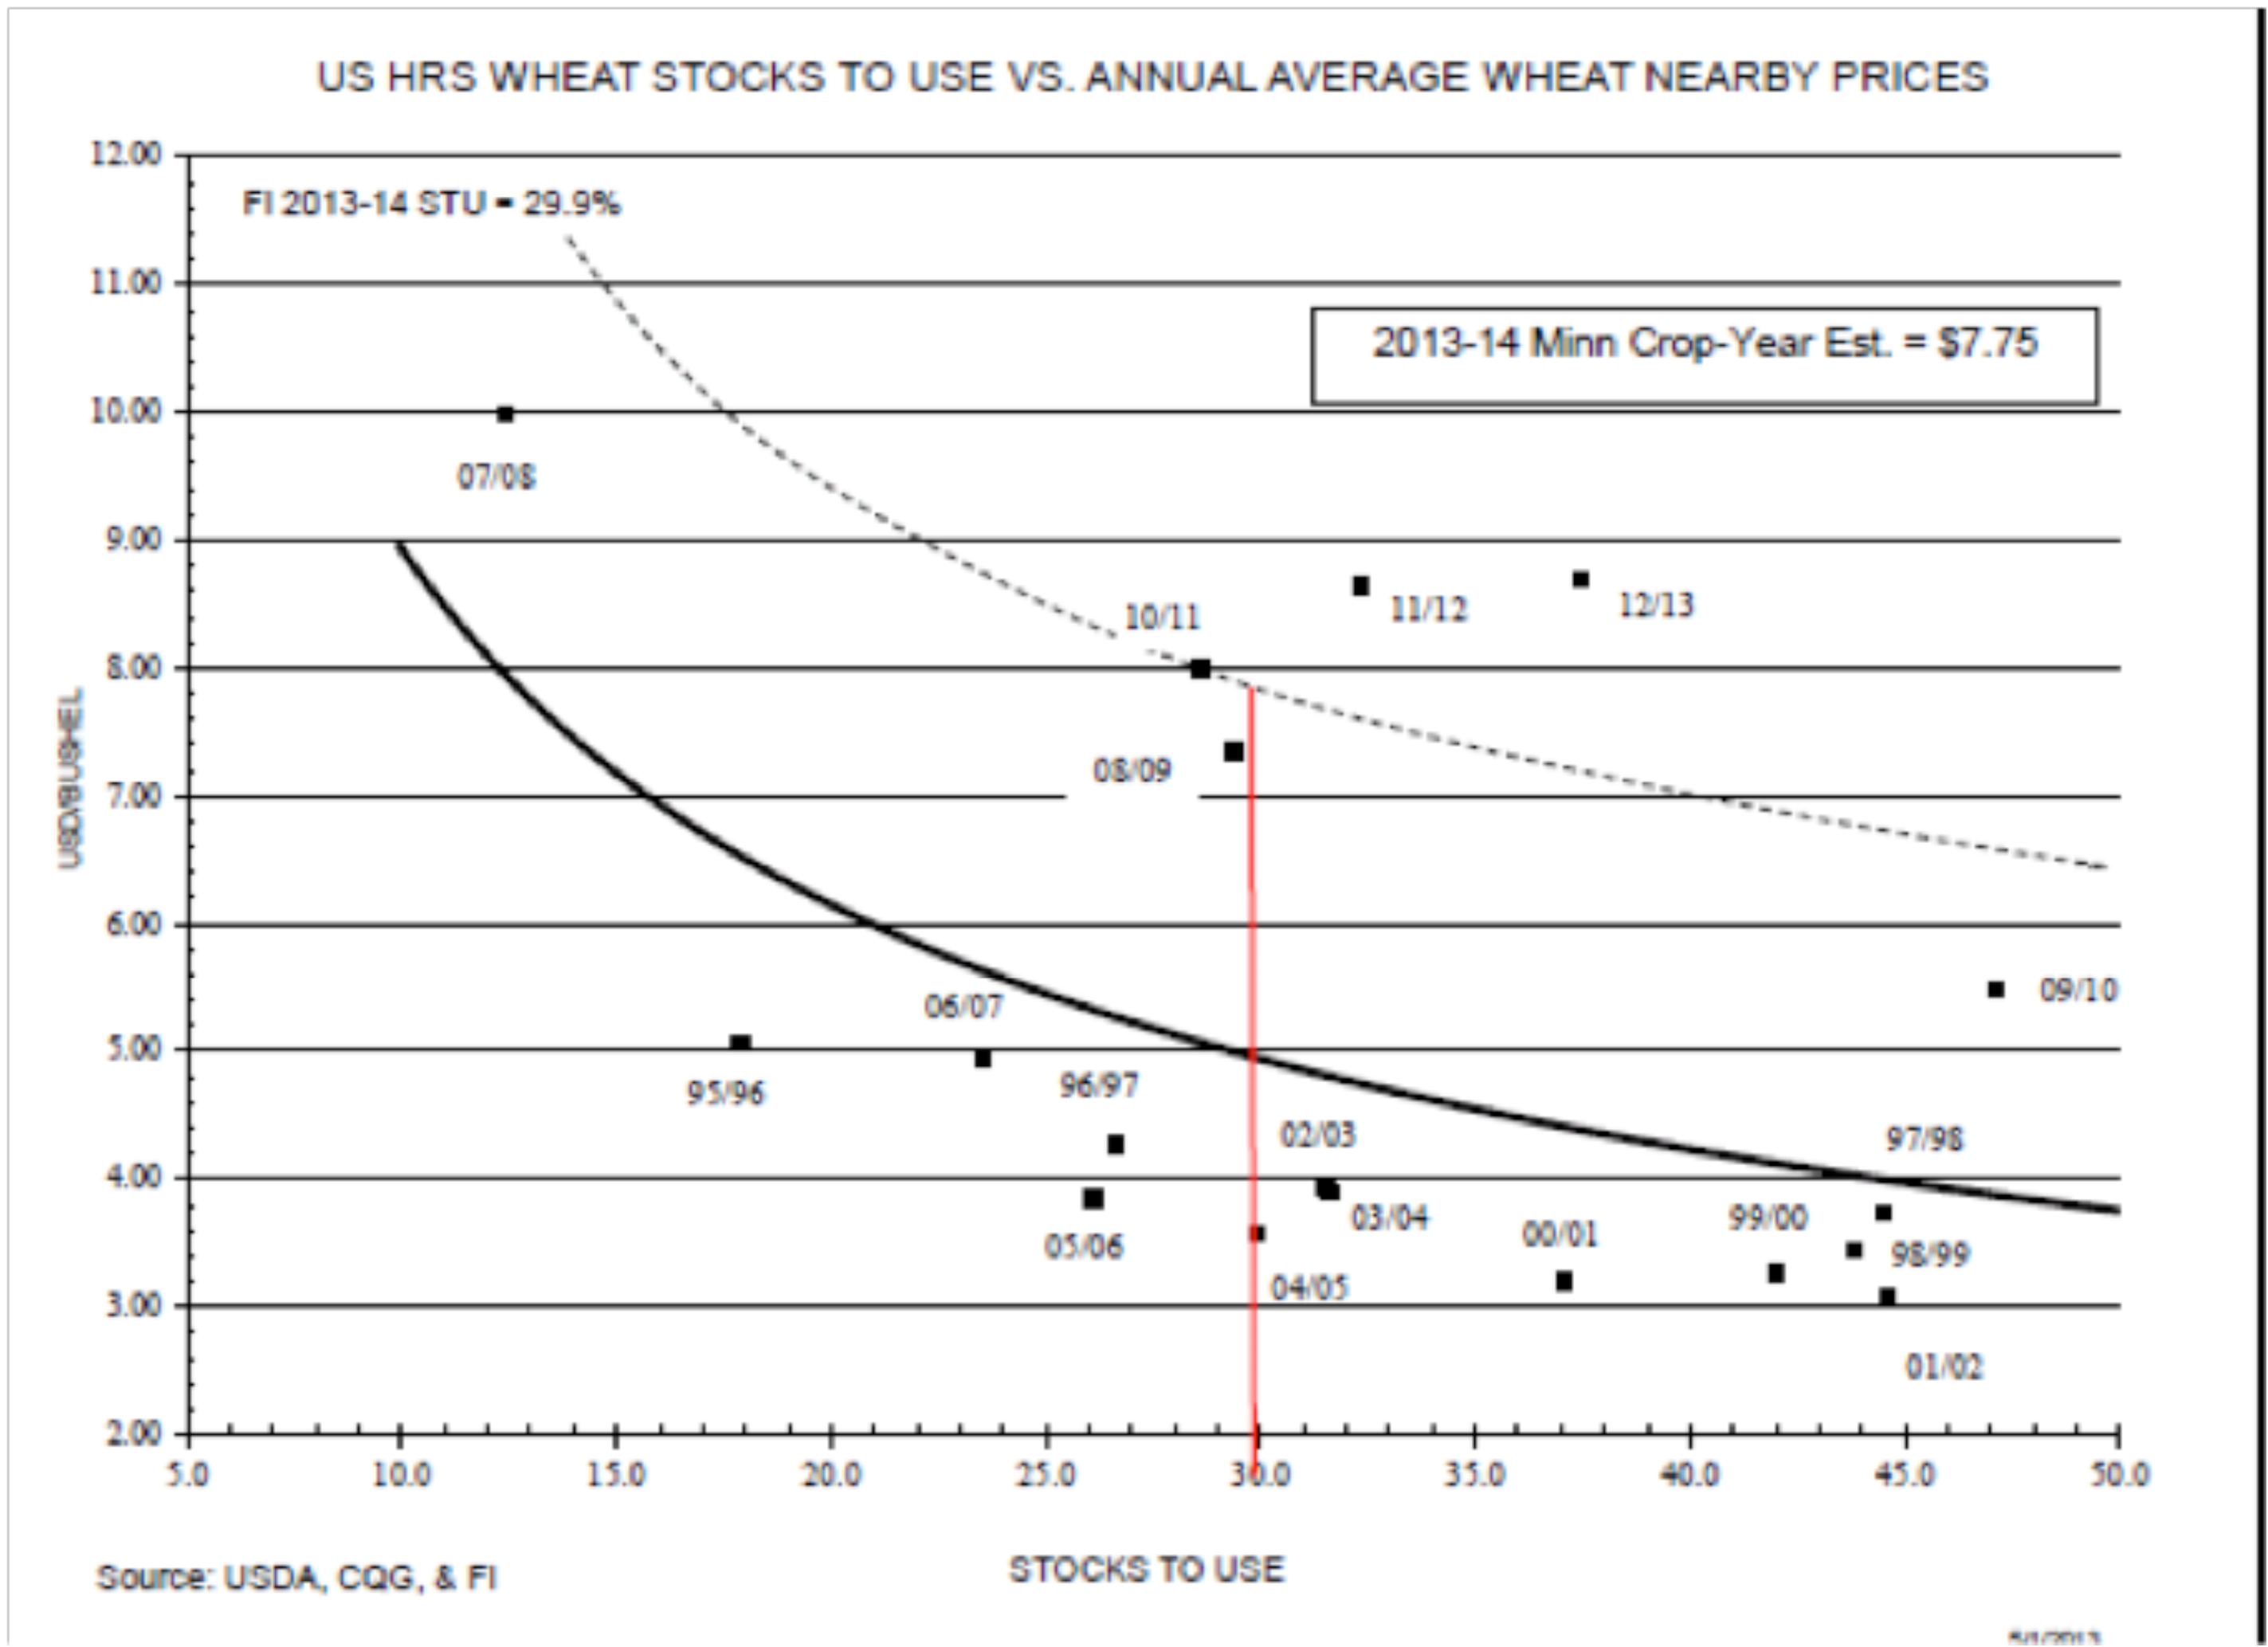
As subsequent reports develop through the growing season which reflect changes in our growing conditions or demand markets the resulting changes in the anticipated stock to use ratios will push the futures markets into trading in a new price range to represent the adjustment. Having a good grip on the relationship on the chart, (stocks to use versus price), enables growers to set intelligent and achievable targets for marketing their crop.
Unless you have an understanding of how wheat stocks to use can drop below 20%, there is no point in pretending that you are going to market wheat when the Minneapolis futures trade $8.50. Ultimately it’s reckless to set goals which can’t be obtained. Not only is it bad business to accept a lower price later, but it is frustrating and discouraging as well.
The exciting part of managing price risk is that the stocks to use ratios do not remain fixed, and especially during the planting and growing season they can shift dramatically in a relatively short period of time. If you want to conduct a little exercise on the accuracy of this system, keep a copy of the chart above and every time that a new report comes out that adjust the stocks to use ratio, watch how the price slides into the corresponding position on the price curve above that ratio.
Anticipating futures levels is reasonably easy because the futures contract is deliverable against real grain. Managing Canadian dollar basis risk is by far the more complicated portion of determining price.