
34
Like Us on Facebook:
BetterFarmingON
Better Farming
February 2017
SATELLITE
IMAGERY
(pixel size), temporal resolutions
(repeat frequency) and spectral
resolutions (number of wavebands
that are imaged). Some sensors will
be more suitable than others for
certain applications.”
Agriculture and Agri-Food
Canada has a geospatial viewer where
the public can access these data
products. The viewer “allows you to
view and analyze image products
– the final output of our integration
of imagery to create customizable and
usable information.”
The advantage of using the geospa-
tial viewer is that the actual output
data files on their own – which are
also available through the Govern-
ment of Canada’s open data portal –
are of limited use without specialized
software and the associated expertise
needed to interpret them, he says.
“Farmers can see and use the data
if they want, but the real power is in
the information provided to agencies
that support the farmers,” says
Davidson.
The frequency with which the
satellites take images is also import-
ant, says Marsh.
“Numerous (satellite) groups
around the world are racing to build
constellations of microsatellites no
larger than a box of shoes,” he says.
“With hundreds of those shoeboxes
orbiting earth, individual groups are
expecting to (capture) the earth every
single day. That frequency of data will
make satellite imagery
(more) actionable
because it will be
much more reliable.”
Schacht similarly
stresses the impor-
tance of frequency.
“When you look at
crop health, it’s crucial
to look at your crop at
the right time,” he says.
“It’s being able to have
the image available at a
reliable cadence and
having it available
opportunistically at the farmer’s
interest.”
Planet Labs currently has 60
satellites in orbit now and is planning
to launch another 116 in the coming
months.
“We have been able to offer
service-level agreements to 85 per
cent of the earth every two weeks,
factoring in clouds. If there were no
clouds, we could provide a re-visit
rate of every week,” he says. “Satellites
also need to be able to source reliable
imagery in terms of geography,
(while) providing a resolution that is
relevant for operations at a field
management level.”
Wainscott similarly stresses the
consistency of the satellites.
“The satellites are 100 per cent
reliable that they will fly, but when
the satellite does fly over (it will either
be) cloudy or clear,” he says. “You are
at the mercy of Mother Nature.”
Because of the uncertainty of
weather, it’s important to have many
satellites in orbit to ensure access to
many images.
“Our goal is to get an image every
10 to 14 days,” he says.
Providers like HDC, Farmers Edge
and WinField United can make
images available to a farmer’s or
agronomist’s device – whether it’s a
smartphone or tractor computer –
fairly quickly and effortlessly.
Schacht, for example, says he is
able to provide retailers or clients
with their images in 24 hours or less.
“In the context of precision ag,
timely information is important,” he
says. “You (typically) need 24 hours
or less to make a
decision.”
Another important
logistical component
of satellite imagery is
the scale.
For example,
“RapidEye (the
satellite) can image 6
million square
kilometres per day.
The resolution for
RapidEye is measured
in five metres; for per-
spective, a drone may
have a resolution of
around five centimetres,” says Marsh.
But this fine resolution is not
necessary for satellite use in ag at this
stage, says Tracey-Cowan.
“On some of our agriculture land,
two-centimetre data is too detailed
for what we are achieving” with
satellite imagery, she says. “If we are
using satellite imagery to assess zones
in the field which can benefit from
being treated or managed differently
(with the variable rates of inputs),
then the resolution only needs to
Ryan Schacht
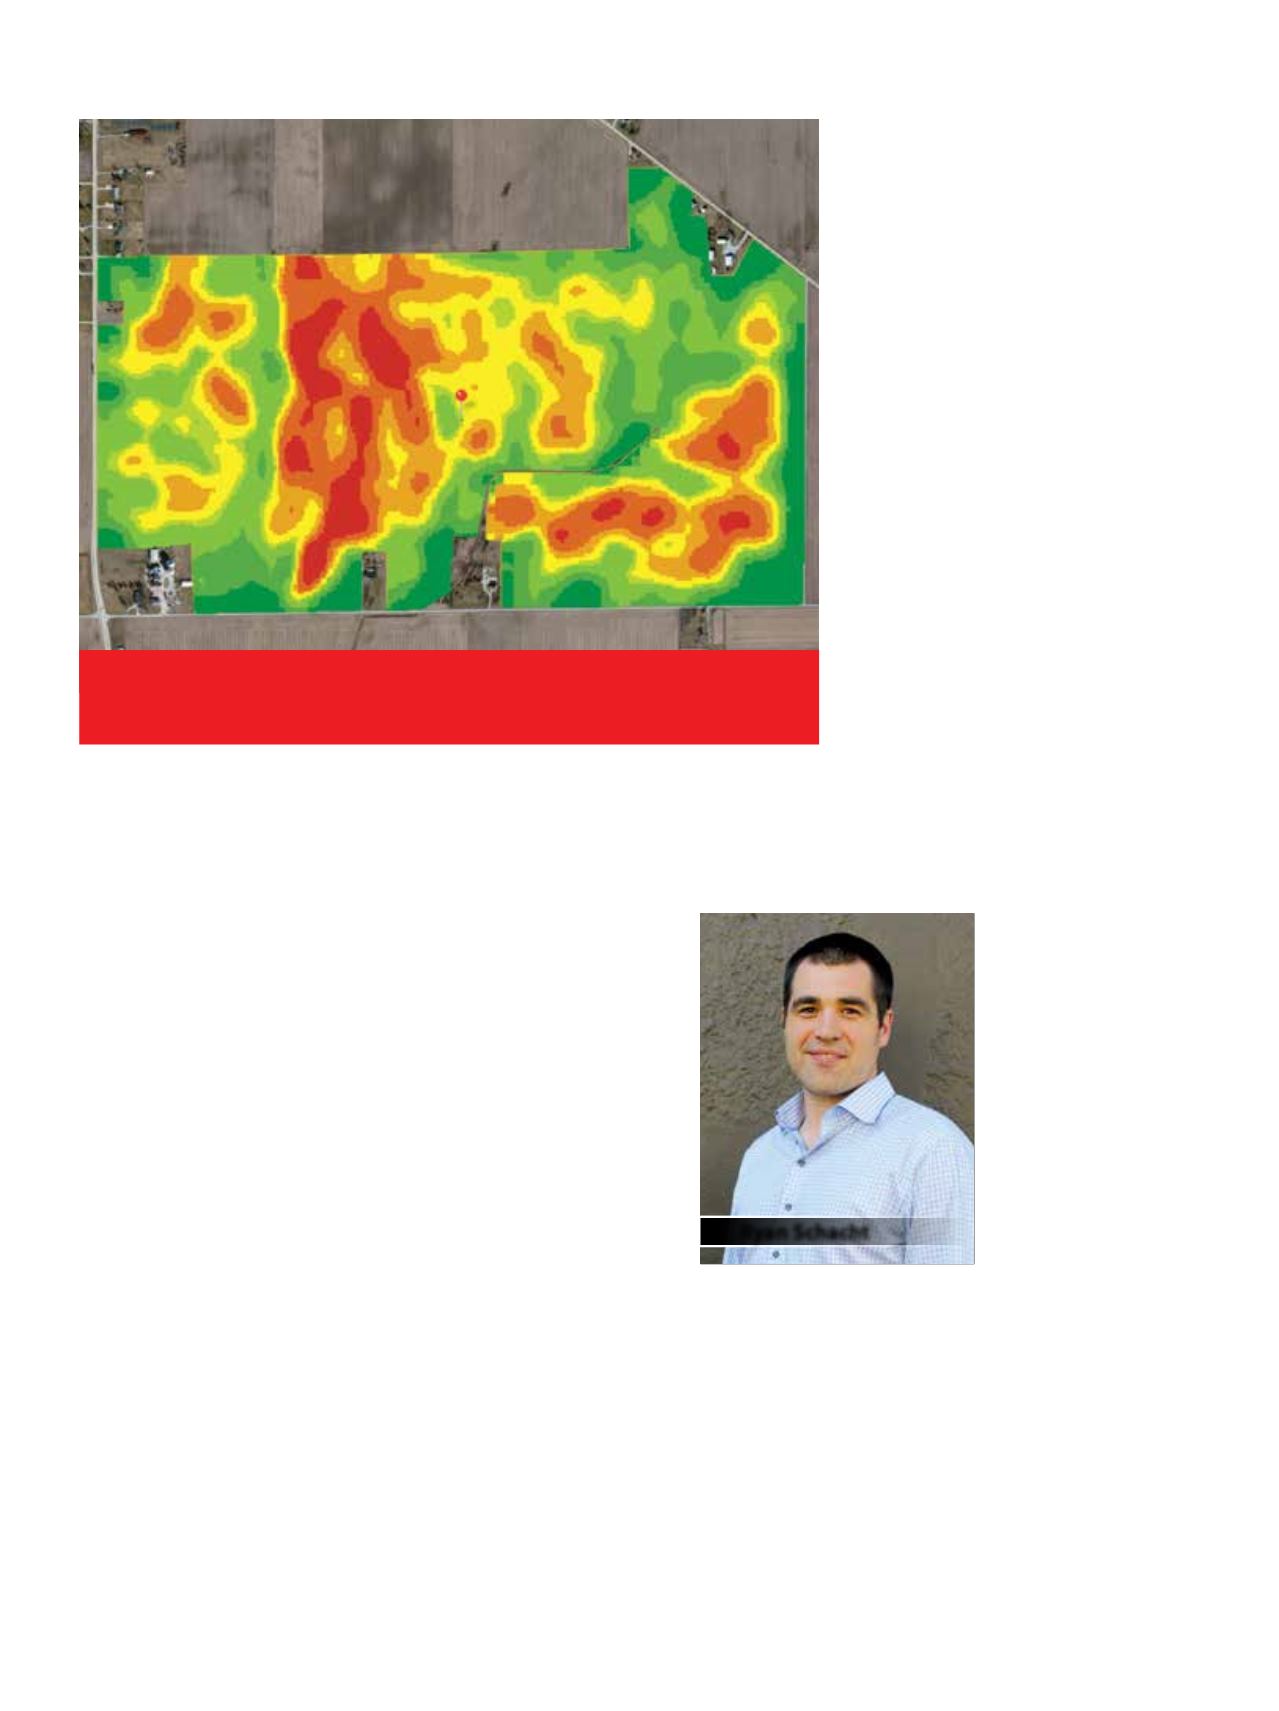
Using a colour scale and the normalized difference vegetation
index (NDVI) of a crop field, tools such as the R7® tool can display
zones of differing biomass, density and health of the crop.
Nathan Wainscott, Winfield United photo


