
32
Follow us onTwitter
@BetterFarmingON
Better Farming
February 2017
SATELLITE
IMAGERY
imagery, Tracey-Cowan says. “Those who use it are
learning something (new) every time” they work with this
imagery.
“It can serve to point out areas of
concern not readily observed from the
ground or it can corroborate information
from other sources, such as yield perfor-
mance regions.”
Determining crop health
Satellite imagery can play an important role
in monitoring fields and using it may be
the first step in evaluating crop health.
Satellite images can be used many ways,
says Richard Marsh, product manager at
Farmers Edge.
“The sensors (from the satellites that
are) used to measure the electromagnetic
radiation (that is reflected off vegetation) are sensitive to
wavelengths that our eyes simply cannot see,” he says. So
in this sense “a healthy crop doesn’t ‘look’ like anything to
us. For this (data) to be useful to others, areas with poorer
vegetation are (traditionally) assigned red colours, and
areas of high vegetation are assigned
green.”
This data collection is well known by
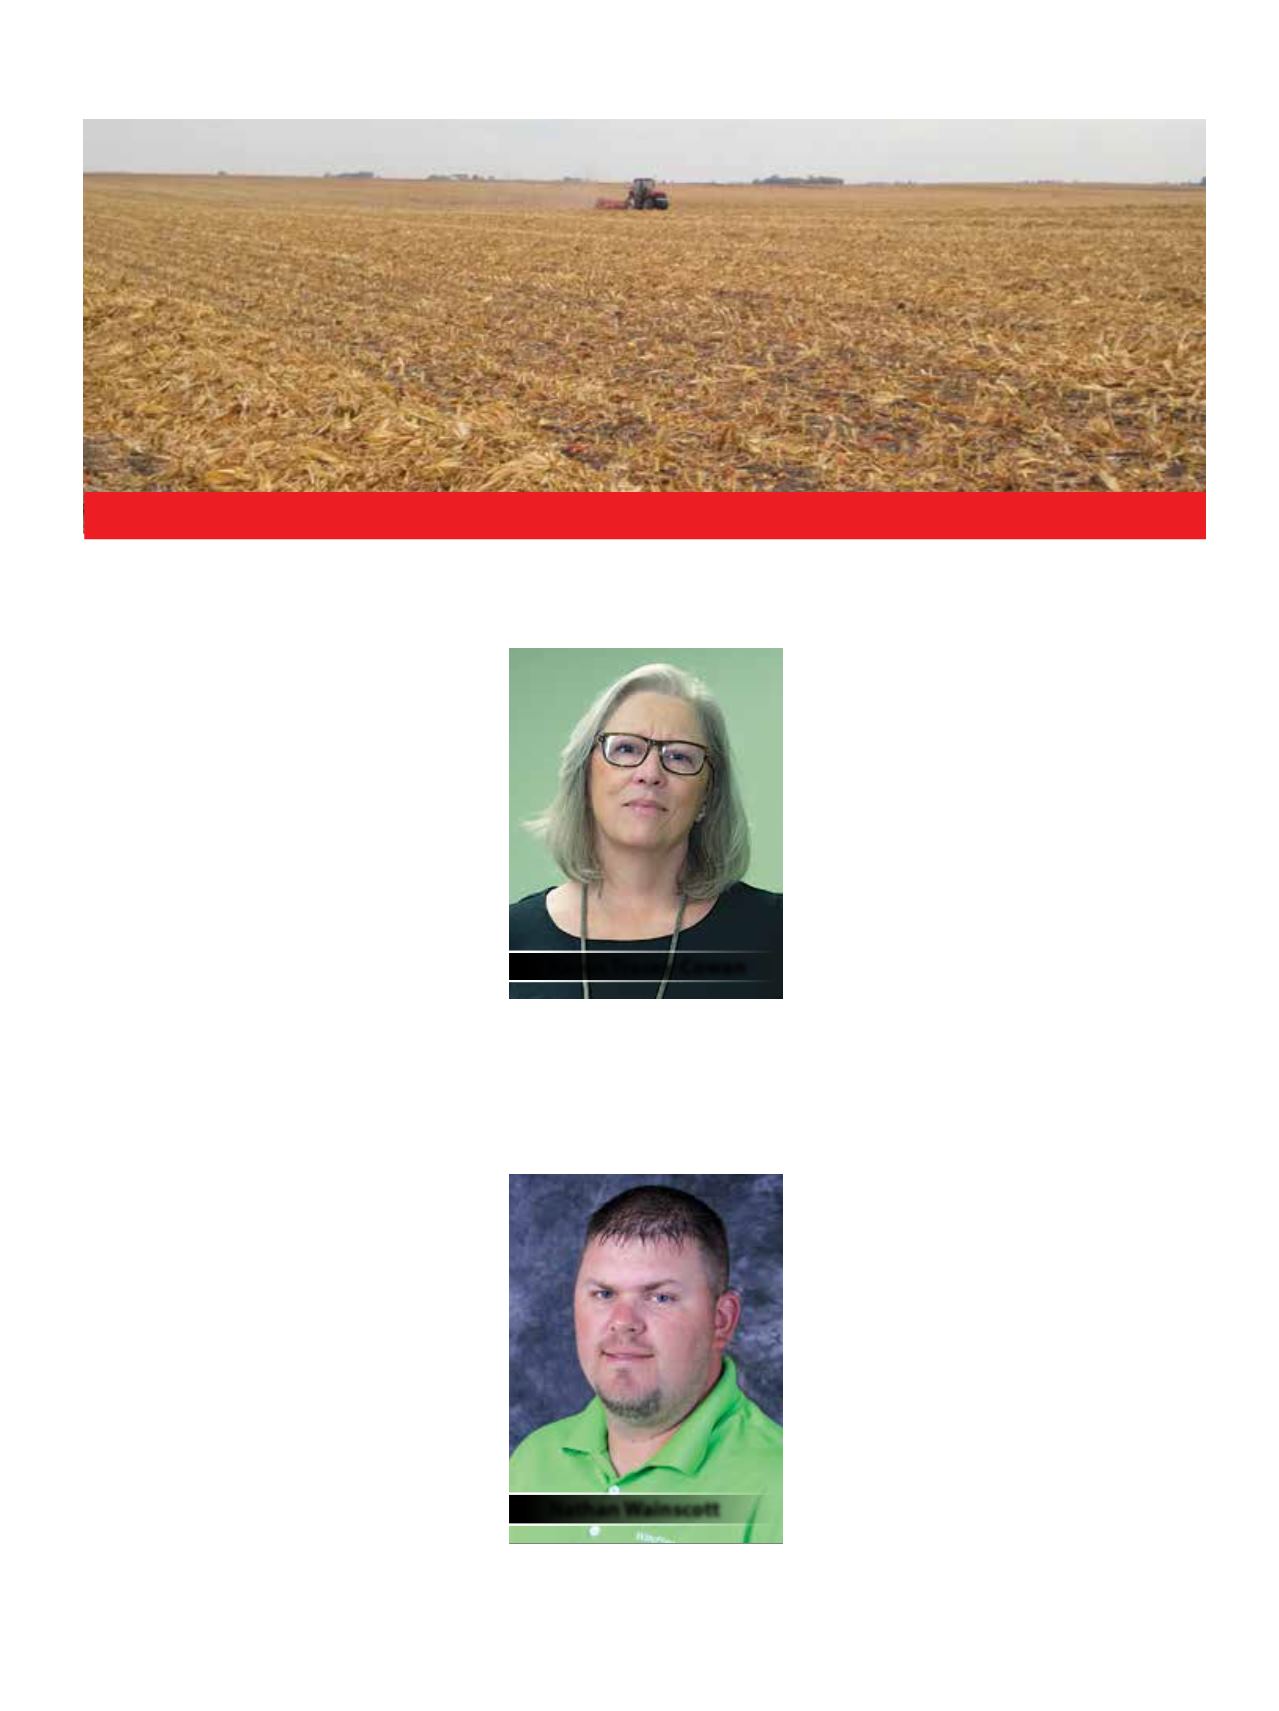
Nathan Wainscott, an agriculture technolo-
gy specialist at WinField United, a compa-
ny that provides training and information
to retailers on its R7® satellite tool.
The R7® tool can specifically capture the
normalized difference vegetation index
(NDVI) of crop fields to assess general
health.
The NDVI is based off of the reflection
of infrared light (wavelengths) that shines
down and the amount of light that shines
back,” says Wainscott.
The tool assesses the NDVI of a crop field and associ-
ates the density and health of the crop with a colour.
Plants lacking in biomass development could be affected
by numerous ailments, such as pest damage or disease
pressure, says Wainscott.
“Our eyes contain receptors that are sensitive to red,
green and blue light. The relative amounts
of light in these wavelengths received by
the eye are then interpreted by the brain as
color. Healthy vegetation appears green to
our eyes because it reflects sunlight more
highly in the green wavelengths than it
does in the blue and the red,” explains
Andrew Davidson, manager of earth
observation operations for Agriculture
and Agri-Food Canada.
“Remote sensors work the same way,
except these ‘eyes in the sky’ (satellite
sensors that scan the earth’s surface) can
also sense in wavelengths not seen by the
eye. Near-IR, shortwave-IR, and
thermal-IR are examples.
“Observations collected in all of these wavelengths can
be combined digitally in creative ways to monitor crop
type, condition and biomass,” he says.
This scaling enables farmers to get a close yield predic-
tion, Wainscott says. Digitally with the
NIR image, “we can break the field up into
a number of zones (red, green, etc.) and
pull ears directly from those zones.” The
tool can determine exactly how much area
each zone covers and, after the ear yield
data is entered, can give a more custom-
ized yield prediction.
“There will always be a scale of colour
on an image. Red (with the R7® tool, for
example) does not necessarily mean the
area is bad; you have to look at how
large the scale is from the red to green,”
he says. “(Satellite imagery) will never
replace boots on the ground (for scout-
ing. The images) direct the farmer to go to specific
spots (of concern) in the field.” The farmer doesn’t need
to “walk the typical W scouting pattern.”
Charles Lalonde,
OFA photo
Karon Tracey-Cowan
NathanWainscott
Satellite imagery has helped Lalonde’s team predict corn biomass well before harvest.


