
Better Farming
February 2017
Follow us onTwitter
@BetterFarmingON
33
SATELLITE
IMAGERY
Satellite imagery used in NDVI
analysis for a growing
crop can also be
applied to bare soil
analysis, according to
Tracey-Cowan, who
commonly supplies
clients with bare soil
imagery classification.
“We can classify the
light-reflection value
(of the soil). This
(classification) helps
create a zone style
map (and shows us
where) to go out and
soil sample. This data can (be
added) to other soil information
(farmers) have, such as yield maps.
“We use the colour to understand
patterns: (the satellite images) don’t
tell (farmers) everything but
(provide) a different perspective.”
Davidson and his team at Agricul-
ture and Agri-Food Canada use these
technologies for monitoring the state
of, and change over, Canada’s agricul-
tural landscape.
Crop type, condition and biomass,
as well as surface soil
moisture conditions,
are all mapped and
analyzed using data
from a variety of
satellite sensors using
sophisticated soft-
ware, according to
Davidson.
Steve Redmond, a
precision ag special-
ist for Hensall
District Co-operative
(HDC), has also
found a fit for
satellite crop monitoring with clients.
Interns at HDC use satellite
imagery to monitor fields and have
been testing the technology by
scouting problem areas indicated in
the images, Redmond says.
“If the image can help you go
directly to the problem spot, it can
help scouting,” he says. “When you
scout, you sometimes only really see a
small percentage of the field. Wheth-
er you are scouting yourself or paying
for the service, satellite imagery can
maximize efficiency. It could cut your
time scouting crops in half.”
In fact, improving scouting
efficiency is one of the most common
uses for satellites in agriculture, says
Ryan Schacht, an agriculture repre-
sentative at Planet Labs Inc., a
satellite image provider. The other
most common uses for satellites in
crop health include creating manage-
ment zones and identifying nutrient
deficiencies.
Logistics
There are many types of satellites
available for use. The intended use of
the images determines the satellite
type.
“To map crop type at the field
level, we use Landsat 8 and RADAR-
SAT-2; for soil moisture, we use
SMAP (Soil Moisture Active Passive);
and for crop condition, we use
MODIS (Moderate Resolution
Imaging Spectroradiometer),” says
Davidson. “These sensors differ in
terms of their spatial resolutions
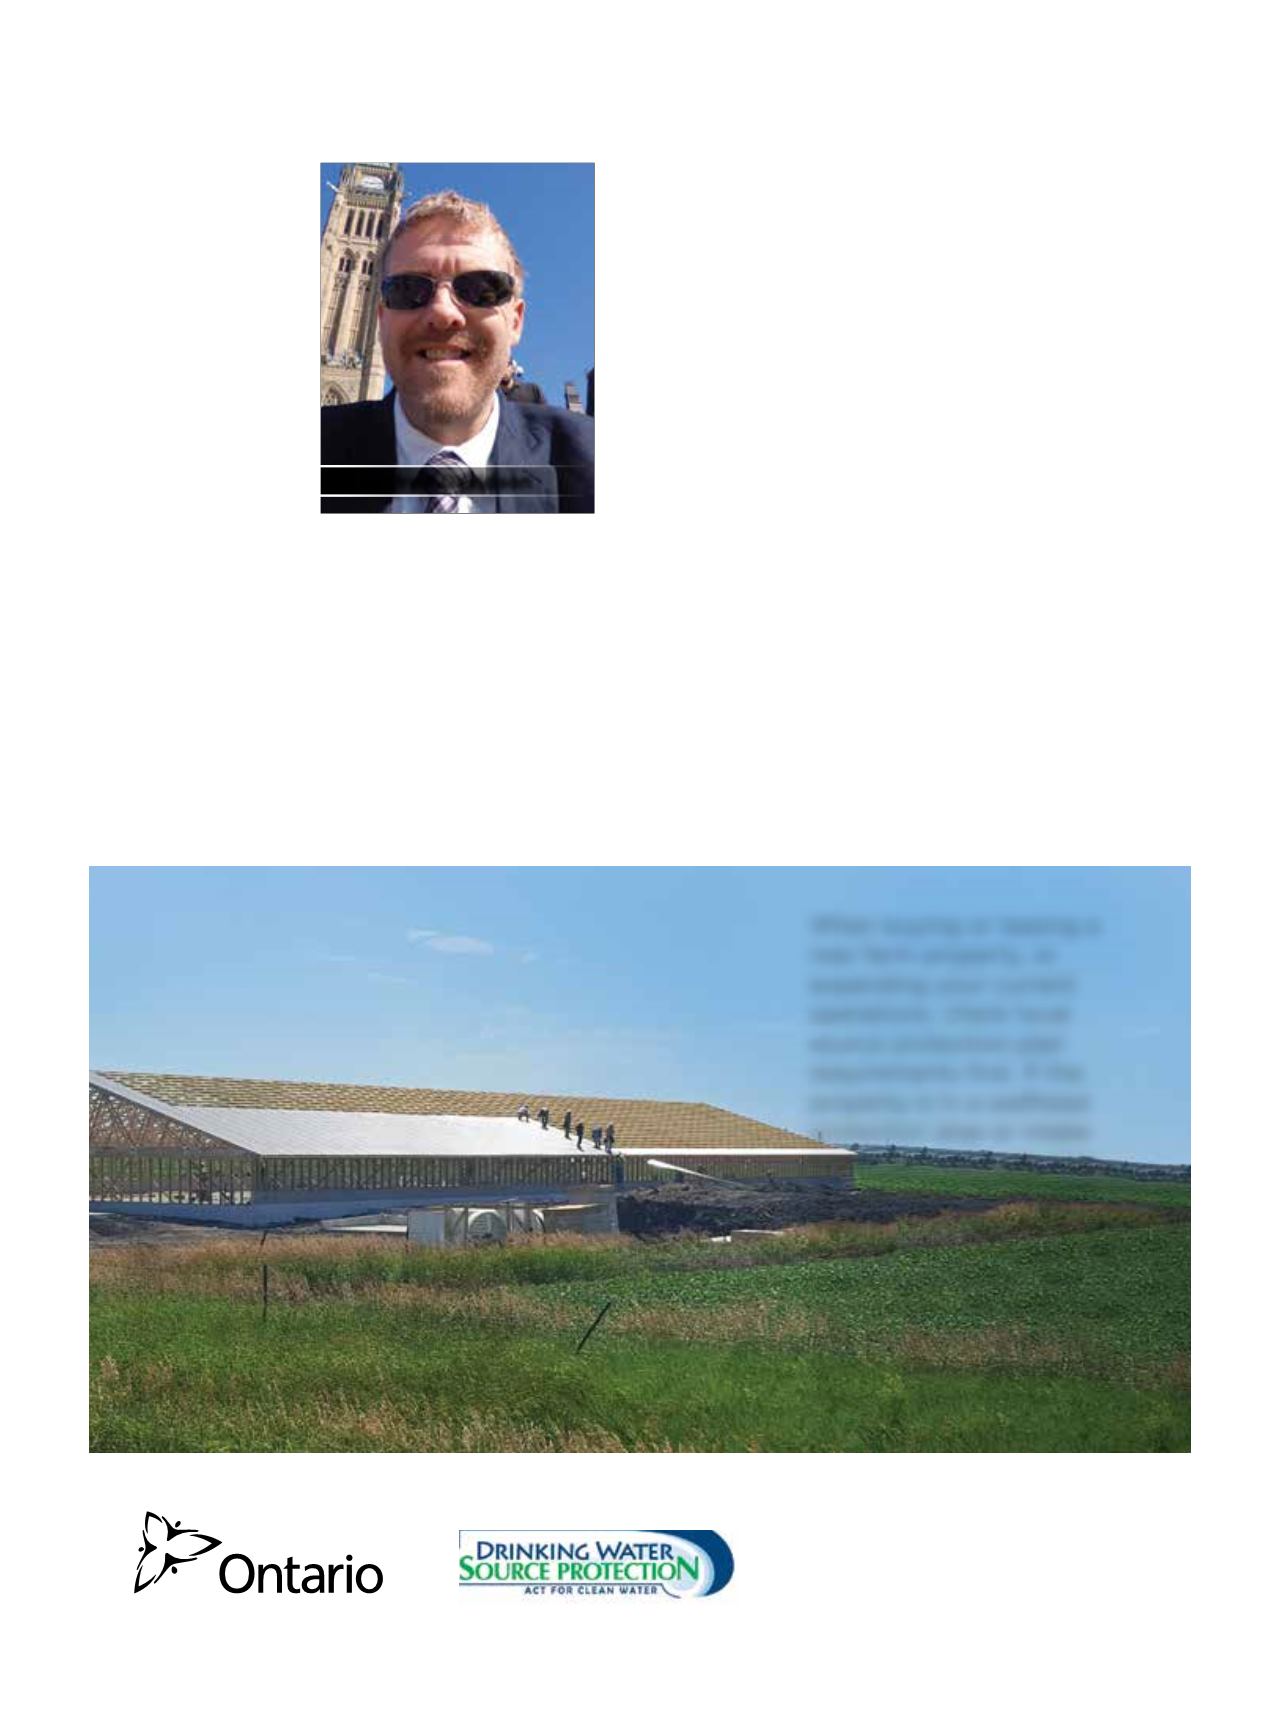
Find the Source Water Protection Map at ontario.ca/ page/source-protection With support provided by When buying or leasing a new farm property, or expanding your current operations, check local source protection plan requirements first. If the property is in a wellhead protection area or intake protection zone, you may require a plan to mitigate risks to drinking water sources and some activities may be prohibited. Your municipality will apply local policies when a building permit is required in limited mapped areas. Buying a farm or expanding your operationsAndrew Davidson


