


Grades A, B…or Fail?
By Paul Hermans
Back in the good old days I dreaded grade school spring report card time. I was always worried about what my parents would think when they saw my report. In some classes I got B marks – others not so.
As planting continues and wraps up through the countryside, it is now time to explore fields to get a report card on emergence as we start setting yield expectations for the 2023 growing season.
Just like me in grade school, some fields always get a great report card, others not so much. It is all based on soil type, what soil conditions you plant into, and the curveballs Mother Nature throws at you, before and during the planting season.
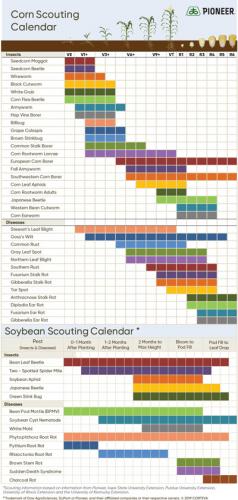
Before heading to the field, it is a good idea to have a refresher on what potential insects or diseases could be affecting your crops. Certain ones are more prevalent at various times throughout the vegetative/reproductive stages. The following charts give a good overview of this.
Keep an eye on weather patterns. Cool, wet conditions mean slower plant growth. This equates to insects and disease having a larger opportunity to attack young seedlings. Corn lives off the seed reserves until about the V2 stage. After that, the root system takes over. Corn is more vulnerable to insects and other pests prior to V2. If you planted untreated seed, or seed without an insecticide, you would need to keep a close eye on pests, especially in heavy manure or high-residue crop rotation situations.
Understanding minimum seed germination requirements for seed in Canada, required by law, will help set the stage for stand counts.
Dave Harwood, technical services manager for Corteva, an active participant in Seeds Canada committees, shared these comments: “For corn the required germination percentage is 90 per cent to be eligible for sale as Certified No. 1 seed in Canada.
“For soybeans that requirement is 85 per cent. Various companies will have higher internal standards. Soybeans can be sold as Certified No. 2 seed if below 85 per cent but above 75 per cent.”
Let us take a deeper dive into planting report cards.
Corn
To gauge your own germination on a field-by-field basis:
- Take several counts across the field to get a representative picture.
- Sample a row based on 1/1000 acre.
- Based on your row width, measure the row length (see chart), and count the number of plants in that distance. Count the number of live plants and multiply by one thousand to get plants per acre.
Sure, simply counting plants sounds simple, but look at emergence as well. If all plants are at the same stage, mark down that number. If plants are more than two leaves behind, count that as being a ‘runt’ in a separate column. Compare the two columns to get an accurate count of stand emergence and uniformity.
Keep in mind any plant that is two collars or more behind will be a weed at harvest time. The goal for higher corn yields is even emergence and uniform cob size across the entire field.
The next question is what could be affecting stand losses. That is where the sleuth in you comes into play. It could be many things, including insects, planter issues, weather, soil conditions and more. Learning to exclude a suspect, like you’re playing a game of Clue, will get you closer to the correct answer.
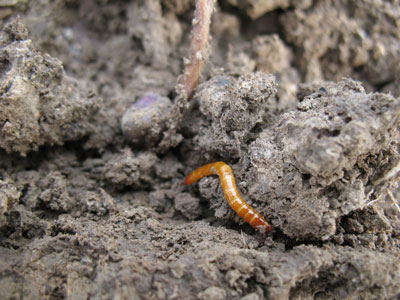
Seed corn maggot, wireworm, black cutworm, and white grubs are the main insect predators attacking seed. Each has a distinct way of tunnelling into a plant/seed which will indicate what insect is affecting your crop. Online images or local seed experts/agronomists can help you determine what pest is affecting your crop.
Now that we have assessed our emergence and tried to solve potential issues, it is time to give our fields a grade.
Grading-wise, I like to see 95 per cent plant stands compared to planting rate. To me this is an A grade. I would consider 90 to 95 per cent to be a B grade, and below 90 per cent is a C grade.
Depending on your corn maturity zone, every 1,000 ears in the field you are missing will equate to six to 10 bushels in lost yield.
As the old saying goes, the biggest yield is when the corn seed is still in the bag. After that it decreases. Doing an excellent job at planting is the first step to keeping that yield.
From a replant perspective, take your initial planting rate and use 50 per cent as a guide for replanting. For example, if you planted at 34,000, 50 per cent would be 17,000 plants per acre. Above this replant number, 95 per cent of the time, it is best to leave that plant stand. Below that, you need to delve more into economics before replanting. Consider replant date, difference in yield, hybrid maturity differences for replants, as well as differences in test weight and moistures at harvest.
Soybeans
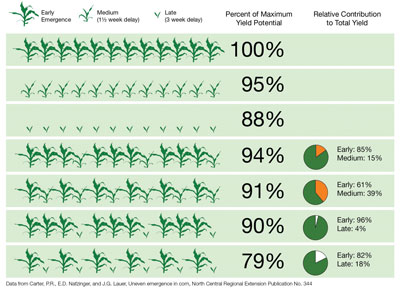
For soybeans, it is harder to pinpoint exact numbers, as soybeans have a longer vegetative growing period and can adjust more to lower populations. In my experience, a 10 to 15 per cent stand loss is normal. Count on higher losses in no-till/strip-till situations and especially following heavy corn residue. Research data would suggest that if we had 60 to 80 per cent plants per acre uniformly of intended planting rate in soybeans, we still have a 100 per cent yield potential.
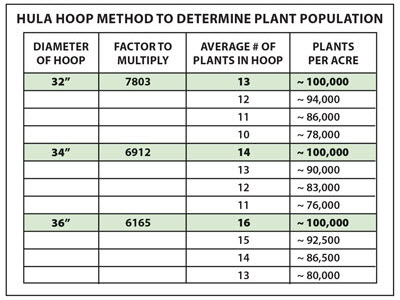
Various methods can be used for counts, including the hula hoop method, tape measure and more. Refer to the chart for guidelines and hula hoop measurements on Page 18.
A key thing to think about is, what is the field you are scouting like? Are plants uniform from one end of the field to the other? Most likely not. Lower population zones will be akin to potential higher weed control issues throughout the growing season due to lack of inter plant competition to choke out weeds. Nitrogen rates in corn can be adjusted based on stand counts, yield potential and projected returns.
Various tools can help us become ‘faster scouters.’ This could mean using drones to fly a field in advance, to in-field walks, using satellite imagery to look at areas of higher versus low plant density growth, referring to long term yield maps (high/medium/low yielding areas) or using soil maps and zones from providers like SWAT MAPS. Keep track of your notes in a suitable crop-scouting program and compare notes over the years. Trends will start to appear and allow you the opportunity to redesign crop management strategies.
Regardless, driving along the road beside your field at 60 km/h and doing a quick glance does not do you, or your crop, any justice.
A lot can learned from report card time. Unlike in school, most folks cannot go back and look at their test to see where they went wrong and what they could have done to make things better.
In agriculture, if we take the time and use the tools made available to us, we can do this on a field-by-field basis to get an improved report card, year in and year out.
Here is hoping you receive a passing grade on all your fields.
OK – ideally an A grade! BF
Post new comment